Building an AI Analytics Agent with Claude API
We built an analytics agent that replaces 8+ hours of monthly manual reporting — five data sources, three report types, a feedback loop that learns from the team's reactions.
Most SaaS teams have analytics data across four or five tools. Few look at it consistently — not because they don't want to, but because pulling numbers from GA4, Clarity, Search Console, and two ad platforms takes an hour, produces different output depending on who runs it, and rarely ends with a clear list of what to do next.
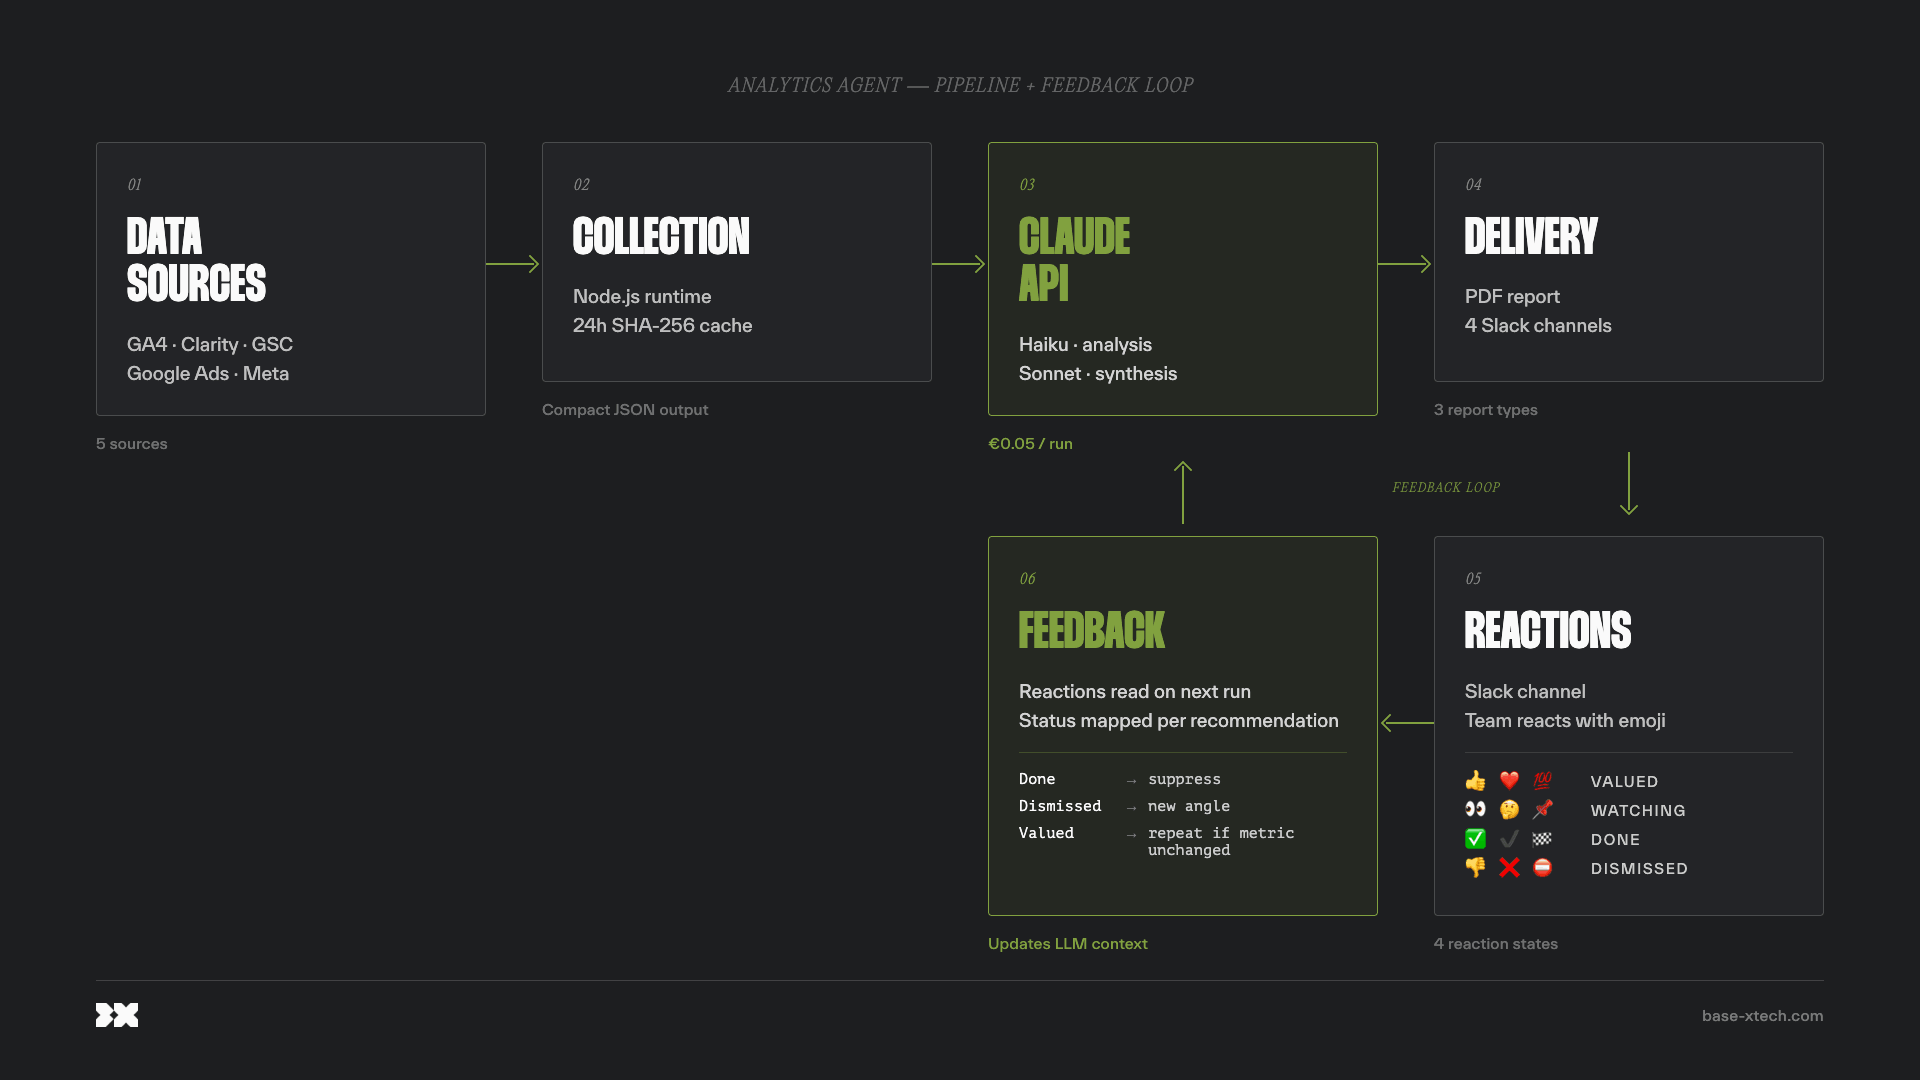
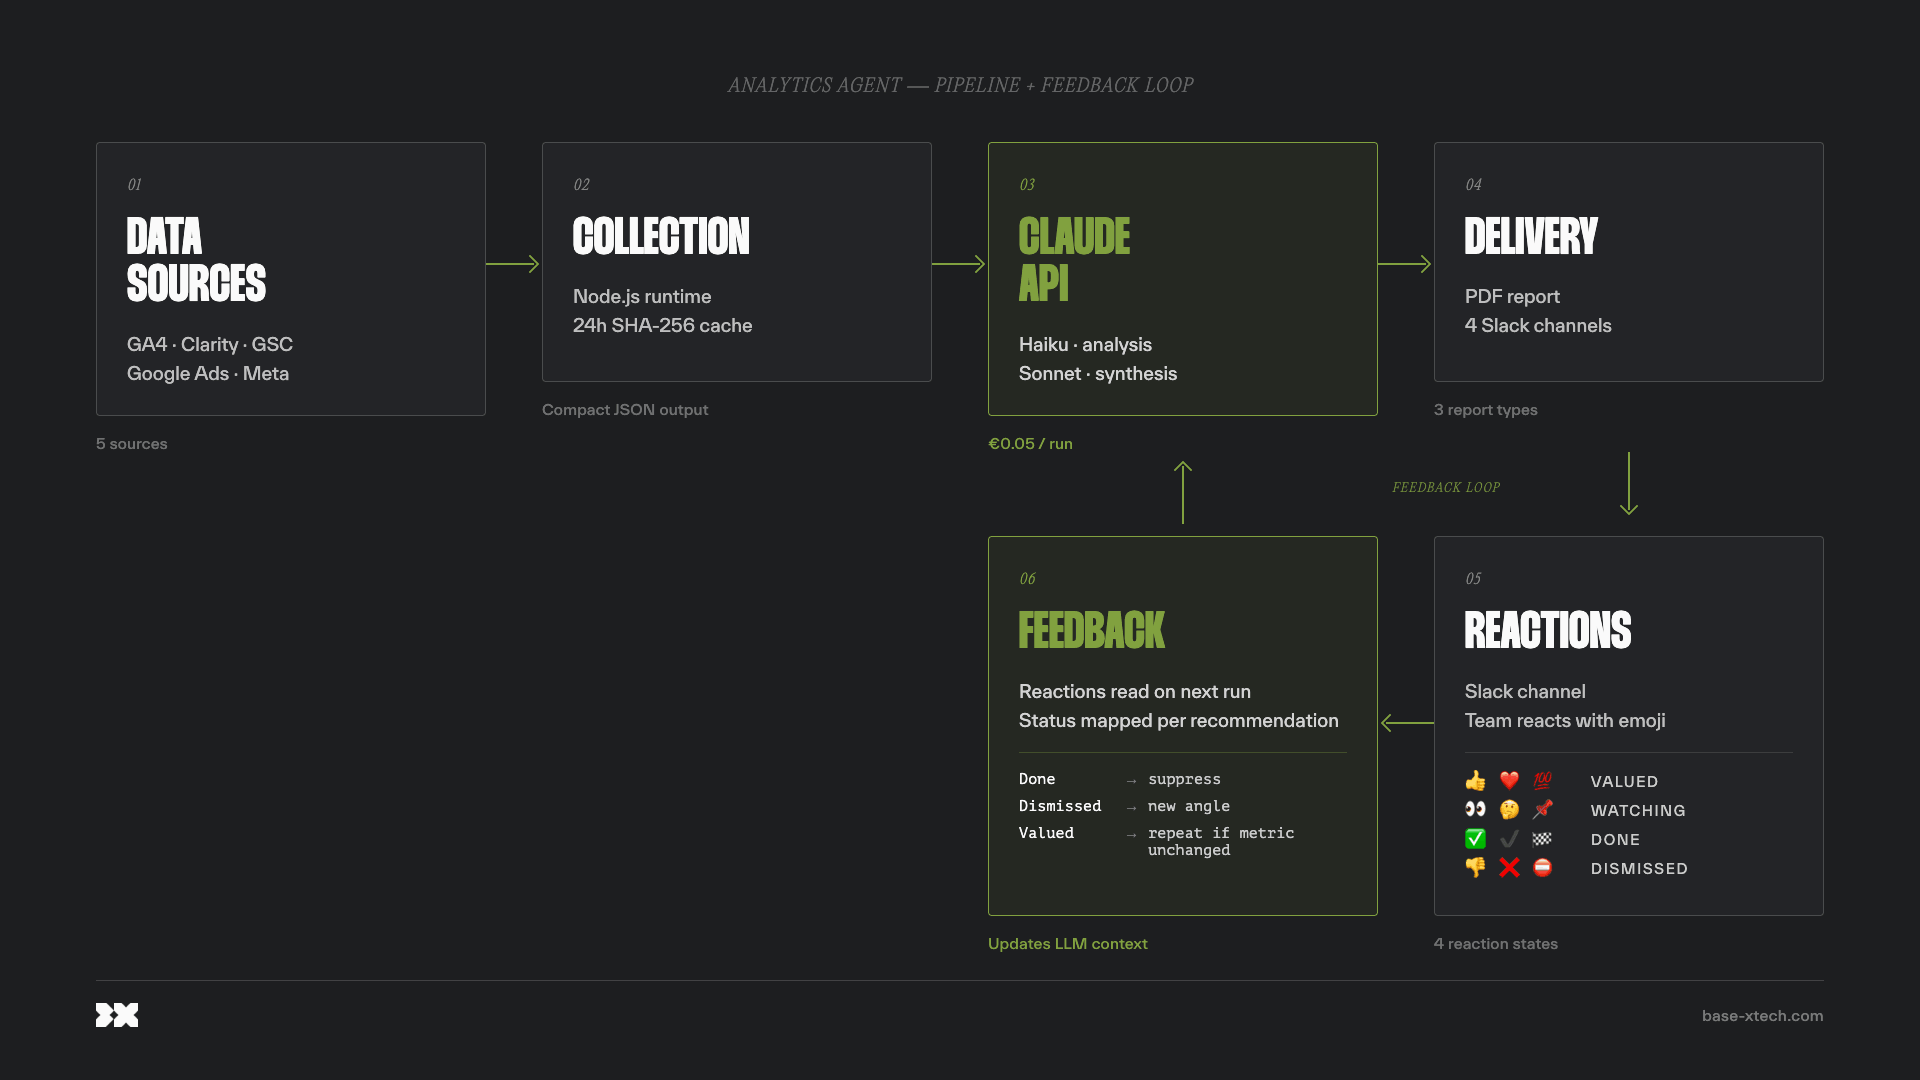
We built an agent that handles this on a fixed schedule: collects data from five sources, passes compact summaries to Claude for analysis, and delivers a structured PDF report with prioritised action items to a Slack channel. The cost is under €0.05 per run in Anthropic API spend. For Chekly — a SaaS company building checkout tooling for Shopify merchants — it saves the growth team at least 8 hours of reporting work a month.
This post covers the full stack, the Claude API integration, and the specific decisions we made to keep it reliable in production.
The starting point
Before building this for a client, we built it for ourselves.
Base X Tech runs an internal analytics agent for our own website: it pulls session data from Microsoft Clarity and traffic data from Google Analytics 4, sends both to Claude for analysis, and posts a structured report to Slack. One message in a channel, roughly five minutes, full report with prioritised action items.
That agent has been running since early 2026. When Chekly needed the same capability across more data sources, I had a working foundation to extend rather than build from scratch — which made the scoping conversation straightforward and the build significantly faster.
The result covers five data sources instead of two, generates three distinct report types on a fixed schedule, and routes each to a dedicated Slack channel.
What the agent does
The agent runs on three schedules:
Daily pulse (Monday–Friday, 10:00 Kyiv time): a one-page PDF covering anomalies against a rolling baseline — sessions, ad spend, conversions, any metric that moved significantly overnight. Delivered before the team starts their day.
Weekly report (Monday, 10:00 Kyiv time): a five-to-seven-page PDF covering all five data sources. Funnel breakdown, search visibility, paid channel performance, session behaviour — plus four prioritised recommendations, each with supporting evidence and a concrete next action.
Monthly strategic report (first of each month): an eight-page PDF covering month-over-month trends across all sources, with a strategic action plan. This is the document a product or growth lead uses to set priorities for the next four weeks.
A fourth alert type — immediate, no PDF — handles failures, token expiry warnings, and configuration issues. These go to a separate ops channel and never interrupt the main reporting channels. The bot never posts outside its four designated channels.
The stack
| Layer | Technology |
|---|---|
| Runtime | Node.js / JavaScript |
| Scheduling | node-cron |
| Sessions and behaviour | Microsoft Clarity REST API |
| Traffic and events | Google Analytics 4 Data API (service account auth) |
| Organic search | Google Search Console API |
| Paid search | Google Ads API |
| Paid social | Facebook Marketing API |
| AI analysis | Anthropic Claude API (Haiku 4.5, Sonnet 4.6) |
| PDF generation | Puppeteer + Nunjucks templates |
| Delivery | Slack (Socket Mode, Bolt for JavaScript) |
| Caching | SHA-256 keyed 24-hour disk cache |
| Deployment | Docker (containerised) |
The codebase was scaffolded from our internal Clarity agent. The cache layer, Dockerfile, Clarity client, and core Puppeteer pipeline carried over without modification. Data clients for Search Console, Google Ads, and Facebook Ads were written from scratch.
How Claude API is used
The agent uses Claude in five distinct tasks across the three report types. The key architectural decision was model tiering — not every task needs the same model. Current model specs and pricing are on Anthropic's models overview page.
Claude Haiku (claude-haiku-4-5-20251001) handles:
- Daily anomaly classification — flagging which metrics deviated from baseline and by how much (max 400 tokens)
- Weekly TL;DR summary — a two-sentence executive summary of the week (max 200 tokens)
- Weekly funnel interpretation — summarising drop-off between funnel stages (max 300 tokens)
Claude Sonnet (claude-sonnet-4-6) handles:
- Recommendations — up to four prioritised action items per report, each with a title, evidence, priority level, and a concrete next action (max 1,200 tokens)
- Monthly strategic analysis — synthesising multi-source trends into a coherent strategic narrative (max 1,200 tokens)
Haiku is fast and cost-efficient for classification and summarisation where the output is short and the input is structured. Sonnet handles the tasks where reasoning quality matters — recommendations and strategic synthesis — where the output directly influences what the team does next.
Cost ceiling: the agent enforces a €0.05 per-run Anthropic spend limit. If the data summary exceeds 6,000 characters, the page table is trimmed to the top 10 rows and the event is logged. This has not been triggered in production.
Language discipline: Claude is instructed to use "possible cause" rather than "the reason is" when explaining metric movements. The agent is surfacing signals, not diagnosing root causes. Overconfident language in automated reports creates more confusion than it resolves.
Repeat suppression: if the same recommendation appeared in the last run and the relevant metric has moved less than 10%, the recommendation is suppressed. Reports that repeat identical advice week after week lose credibility fast.
What Claude never sees: raw API payloads. Every data module produces a compact JSON summary — normalised metrics, not raw rows — before it reaches the model. This keeps prompts clean, costs predictable, and avoids passing unnecessary data.
How the agent learns over time
The repeat suppression logic handles the simple case: don't say the same thing if nothing has changed. The Slack-based feedback loop handles everything else.
Each recommendation posts as a threaded reply under the report's headline message. The team reacts with emoji — no forms, no extra tools. The agent reads those reactions before each run and maps them to a status:
| Reaction | Status | What happens next |
|---|---|---|
| 👍 ❤️ 💯 | Valued | Repeat if the metric hasn't improved |
| 👀 🤔 📌 | Watching | Keep unchanged |
| ✅ ✔️ 🏁 | Done | Drop — already actioned |
| 👎 ❌ ⛔ | Dismissed | Replace with a different angle |
| No reaction | — | Treat as Watching |
This status data is passed to Claude as context on the next run. A recommendation marked done doesn't appear again. One marked dismissed gets replaced with a different angle on the same problem. Over time, the recommendations shift toward what the team is actually working on rather than what the data shows in the abstract.
The implementation keeps 20 runs of recommendation history — enough to track patterns without the context window growing indefinitely.
Key engineering decisions
One source failing does not kill the run. If Google Ads returns a 401, the weekly report renders without the Ads section and marks it as unavailable. The other four sections are unaffected. A credential issue in one integration should never block the rest of the report.
Calibration mode before anomaly alerts. The daily pulse runs in calibration mode for the first two weeks — collecting data to establish the rolling baseline without sending alerts. Once the baseline is stable, calibration mode disables and anomaly detection starts. I added this after the first test deployment sent a flood of false-positive alerts on day one. It's the kind of issue that's obvious in retrospect and easy to miss in spec — worth building in from the start on any agent that runs anomaly detection.
No data fabrication. If a source returns zero or fails entirely, the agent reports it as such. It does not estimate, interpolate, or fill gaps. The run log records every failure regardless of whether the report went out.
Date-stamped outputs. Each PDF is written with a date in the filename. A same-day re-run appends _v2, _v3. Previous outputs are never overwritten — useful when a report needs to be referenced after the fact, or when a re-run is triggered to fix a credential issue.
What the build taught us
Credential coordination is the hidden calendar cost. The code took roughly a week to write. Getting authenticated access to five platforms — with the right accounts, correct OAuth client types, and proper scopes — took another six days. Every platform has its own flow, its own error messages, and its own approval process. Budget for this in your timeline, not just the build itself.
Probe-first development pays off. Before running any full report, we built a probe: a single command that calls each data source once and reports pass or fail per integration. Every credential issue was caught and localized in seconds rather than traced through a full pipeline run. Build the probe before the runners.
Token caps need more buffer than you expect. The monthly strategic analysis hit max_tokens twice in testing, truncating mid-sentence. The original cap was 600 tokens — bumped to 1,200 after that. On any LLM task where the prompt context grows over time, a 2× safety margin costs almost nothing and prevents a class of failure that's hard to debug.
Currency is metadata — pass it explicitly. Early test reports mixed UAH spend and USD spend, both displayed as $. The LLM generated plausible-looking cross-channel comparisons that were mathematically wrong. Every spend value in the templates is now explicitly labelled, and the LLM receives currency context in its prompt. Don't assume the model will infer it from surrounding data.
When it's worth building
There's a gap between AI tooling that looks useful and AI tooling that actually is. The difference usually comes down to one question: does it replace a specific recurring task with a specific time cost, or does it produce output that someone still has to verify before acting on?
For this agent, the answer is concrete — Chekly's growth team saves at least 8 hours of reporting work a month. That's the metric we care about, not that it uses AI. I've seen implementations that looked impressive until the team realised the output required the same judgment call to interpret as doing it manually. Those don't survive past the first month.
If your team has a recurring reporting workflow that takes one to two hours per cycle and produces inconsistent output depending on who runs it, this architecture is a direct fit. If the underlying data is unreliable or the team hasn't agreed on what "good" looks like, fix that first. The agent will make the inconsistency faster and more visible — which isn't useful.
Deployment
The agent runs on infrastructure we set up and manage as part of the engagement. Nothing was required on Chekly's side beyond granting API access to the five data sources. All five integrations — including Google Ads, which required a developer token review from Google — are connected and operational.
Frequently asked questions
What data sources does the agent support?
The current deployment connects to Microsoft Clarity, Google Analytics 4, Google Search Console, Google Ads, and Facebook Ads. The architecture is modular — adding or removing a source means writing one new data client; the rest of the pipeline is unchanged.
How much does it cost to run per month?
At the current schedule — daily pulse on weekdays, weekly report on Mondays, monthly strategic report — Anthropic API costs stay well under €0.05 per run. The larger fixed cost is the infrastructure it runs on, which we set up and manage.
Can this work for Shopify merchants, not just SaaS companies?
Yes. The data sources — GA4, Clarity, paid channels — are standard across both. We are expanding this as a managed service for Shopify merchants in H2 2026. If you want to scope something similar, get in touch.
How long does a deployment like this take to set up?
Three to four weeks is a reasonable estimate for a first deployment. The actual build time — writing the code, wiring the integrations, rendering templates — is closer to a week. Most of the calendar time goes to credential coordination: getting authenticated access across five platforms, with the right OAuth flows and correct scopes, typically involves several rounds of back-and-forth. A repeat deployment using an existing template is faster — the core pipeline, cache layer, and PDF renderer carry over without modification.
What happens when one data source goes down?
The report renders without that section and marks it as unavailable. The ops channel receives an alert. The other sources are unaffected — a credential issue in one integration doesn't block the rest of the run.
Does this replace an analyst?
No. It removes the mechanical part: pulling numbers from separate tools, assembling them into a consistent format, and generating a first-pass interpretation. Deciding what to act on and why stays with the team. The goal is to give analysts better starting material, not to replace the judgment.
Base X Tech is a Shopify development agency working with e-commerce brands across Europe and the Asia-Pacific region. We build custom Shopify solutions and AI-powered operational tooling. If you want to scope a similar agent for your team, contact us.